My Tool 'Box'
Tools are exciting and are constantly evolving. I love working with tools to make my work more efficient, but understandng the business problem plus the right tool is the combo I'm excited about. Nonetheless, my tool 'box':
Hi there! Welcome to my space. I'm a data Scientist and I really love my job. My skill set encompasses data management, analysis,machine learning and visualization- all designed to provide your business with valuable, data-driven outcomes.
I develop predictive models that give your business a glimpse into the future. Each tool is chosen specifically to best solve the task at hand.
Say 'Hi' on LinkedIn .Tools are exciting and are constantly evolving. I love working with tools to make my work more efficient, but understandng the business problem plus the right tool is the combo I'm excited about. Nonetheless, my tool 'box':
This task focused on using classification algorithms to predict income levels in a selected demographic, utilizing Python's robustness and Azure MLD's cloud-based platform. The analysis was performed on the Adult Dataset from the UCI Machine Learning Repository.
The goal was to gain insights into income level determinants and broader socio-economic dynamics.
Three classification algorithms (Random Forest, KNN, Decision Tree) were applied, with Random Forest showing a good performance score of approximately 85.7% accuracy and a high ROC-AUC score, indicating effective class separation and robustness against overfitting. The EDA and recommendations for this analysis, as well as a comprehensive report,are detailed in the github repository for this project.This project has also been done using Azure Machine Learning Designer. The details are in the report.
This project focuses on forecasting web traffic for various Wikipedia articles, using a collection of sophisticated time series analysis models implemented in Python.
The objective was to accurately predict daily views, facilitating better resource allocation and strategic planning for Wikipedia. Insights derived from this analysis could also inform broader content strategy adaptations.
Four different time series forecasting methods were employed—ARIMA, LSTM, XGBoost, and Prophet—with each model tailored to capture specific aspects such as seasonality, trend, and random fluctuations inherent in web traffic data. LSTM and Prophet models, in particular, demonstrated robust performance, capturing complex patterns effectively.The analysis, detailed explorations, model comparisons, and comprehensive evaluations are thoroughly documented in the GitHub repository. This project also includes visualizations of predictions versus actual data, offering a clear view of model accuracy and performance.

The goal of this task was to apply clustering algorithms to the UCI Online Retail Store Dataset, focusing on customer segmentation and behavior analysis.
Two clustering algorithms, K-Means and Hierarchical Clustering, were applied. The optimal number of clusters was determined using the WCSS Elbow Method and Silhouette Scoring Method. The analysis included examining the distribution of the 'Quantity' feature across clusters through boxplots and visualizing clusters in 2D scatter plots. Clusters were characterized by various purchasing behaviors: mainstream transactions, higher value transactions, bulk purchases, and outlier transactions.
The EDA and recommendations for this analysis, as well as a comprehensive report,are detailed in the github repository for this project.This project focuses on analyzing text data from the Netflix Movie and TV Show dataset to understand the sentiments and narratives in the streaming content industry. Utilizing Python libraries and NLTK for sentiment intensity analysis, the project aims to quantify emotional content and uncover trends in various dimensions such as genre, providing a data-driven narrative of the industry's landscape.
The analysis involved sentiment analysis using VADER (Valence Aware Dictionary and sEntiment Reasoner), frequency analysis, topic modeling, word clouds, and N-gram analysis. Sentiment scores were computed and analyzed through histograms, revealing a distribution with a peak around the neutral zone. Genre sentiment analysis was conducted by splitting and expanding genres, and average sentiment scores for top actors were plotted.
The EDA and recommendations for this analysis, as well as a comprehensive report,are detailed in the github repository for this project.
This research provides a detailed analysis of global health systems, examining the interplay between demographics, fiscal allocation, mortality, health system equity, and efficacy from 2010 to 2021. It employs a blend of qualitative, quantitative, and domain-specific methodologies to offer a holistic view of health systems across various socioeconomic contexts. The primary aim is to identify patterns, disparities, and correlations, offering insights into global health systems to inform policies, best practices, and data scientists focusing on economics.
The analysis encompassed descriptive statistics to understand data distribution and properties. Statistical measures such as mean, median, mode, standard deviation, skewness, kurtosis, range, IQR, variance, and quantiles were calculated. Visual EDA included boxplots, histograms, scatterplots, and multivariate plots to understand data distribution, outliers, and relationships among variables. The EDA and recommendations for this analysis, as well as a comprehensive report,are detailed in the github repository for this project.
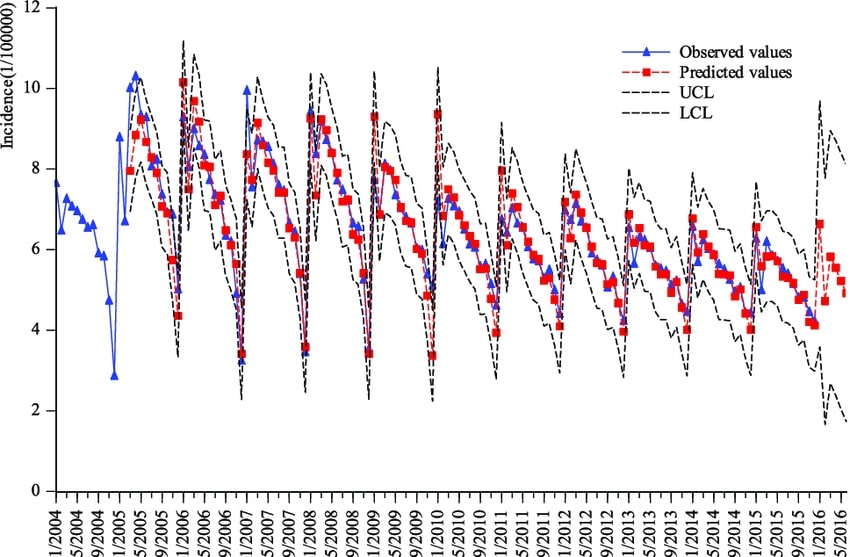
ARIMA is an acronym that stands for AutoRegressive Integrated Moving Average. This is one of the easiest and effective machine learning algorithm to performing time series forecasting. This is the combination of Auto Regression and Moving average. ARIMA is an algorithm used for forecasting Time Series Data. Using this model, we can analyze and model time-series data to make future decisions. Some of the applications of Time Series Forecasting are weather forecasting, sales forecasting, business forecasting, stock price forecasting,etc For stationary data, ARIMA model is required; seasonal data, Seasonal ARIMA (SARIMA) is required.

The Google ecosystem is a fantastic innovation. It was my first go-to in my journey before I was swayed by Microsoft. For this simple analysis & Visualization, we highlight D&S Health Tech. D&S is a mental health tech-ed organization. D&S has just completed a sales campaign. The Sales team needs some insights(revenue,products,coupons,etc.) from some sales data submitted. This analysis and visulaization was done using Google Data Studio, while the dataset was collected on Google Sheets.

Our client is a major gas and electricity utility that supplies to corporate, SME (Small & Medium Enterprise), and residential customers. The power-liberalization of the energy market in Europe has led to significant customer churn, especially in the SME segment. They want to diagnose the source of churning SME customers. A fair hypothesis is that price changes affect customer churn. Therefore, it is helpful to know which customers are more (or less) likely to churn at their current price, for which a good predictive model could be useful. Moreover, for those customers that are at risk of churning, a discount might incentivize them to stay with our client. The head of the SME division is considering a 20% discount that is considered large enough to dissuade almost anyone from churning (especially those for whom price is the primary concern). An initial team meeting was held to discuss various hypotheses, including churn due to price sensitivity. Deeper exploration is required on the hypothesis that the churn is driven by the customers’ price sensitivities. The client plans to use the predictive model on the 1st working day of every month to indicate to which customers the 20% discount should be offered. We would need to fomulate the hypothesis as a data science problem and lay out the major steps needed to test this hypothesis. Communicate your thoughts and findings to the client, focusing on the data that we would need from the client and the analytical models we would use to test such a hypothesis.

Data cleaning is a pertininet part of end to end data analysis process. SQL, in my opinion is a great tool. Apt, concise. The quality of the data we use determines the quality of the results and insights we get. Many professionals believe that we should dedicate more time to preparing and cleaning the data rather than other processes like EDA, ML, and others. Otherwise, we could finish with a bunch of inaccurate output. In this project I drive a cleaning data process to prepare data for analysis by modifying incomplete data, removing irrelevant and duplicated rows, splitting addresses, and modifying improperly formatted data. Data cleaning is not about erasing information to simplify the dataset, but rather finding a way to maximize the accuracy of the collected data. Let’s go over cleaning techniques with a Housing dataset. It has 56K+ rows. Let’s get started!.


Covid-19 was tough. It's the first pandemic I have ever witnessed and my world turned 360. This project is a simple data exploration excercise using Structured Query Language with real data sets from the Covid-19 pandemic. I do intend on working more with this data because the dataset is extensive. On Data exploration and aggregation, these are two significant aspects of data analysis while processing with transactional data stored in SQL Server for statistical inferences. For data exploration using data science languages like SQL, data often needs to be filtered, re-ordered, transformed, aggregated and visualized. There are many possibilities for achieving these functionalities.

Web scraping (or data scraping) is a technique used to collect content and data from the internet. This data is usually saved in a local file so that it can be manipulated and analyzed as needed. If you’ve ever copied and pasted content from a website into an Excel spreadsheet, this is essentially what web scraping is, but on a very small scale. However, when people refer to ‘web scrapers,’ they’re usually talking about software applications. Web scraping applications (or ‘bots’) are programmed to visit websites, grab the relevant pages and extract useful information. By automating this process, these bots can extract huge amounts of data in a very short time. SR:Careerfoundry

The analyst is currently cooking new visualizations. Check back soon!

Currently writing multiple lines of code using python. Please check in soon